In today’s smart refrigeration systems, real-time data visualization plays a critical role in efficiency, reliability, and cost savings. One of the most powerful tools available to facility managers and business owners is the use of graphs to monitor refrigeration performance.
🔍 Why Graphs Matter in Refrigeration
Graphs transform raw data into easy-to-understand visual insights. Instead of scanning endless numbers, a quick look at a chart can show you temperature trends, defrost cycles, fan activity, and alarms.
Key benefits include:
-
Instant Clarity – Easily see if your cooler or freezer is maintaining the correct temperature range.
-
Faster Troubleshooting – Identify abnormal patterns such as frequent temperature spikes, compressor short cycling, or extended defrost periods.
-
Better Compliance – Temperature history graphs help meet food safety and HACCP regulations by keeping a visual record of cooling performance.
-
Energy Efficiency – Pinpoint inefficiencies, such as fans or compressors running longer than necessary, to reduce electricity costs.
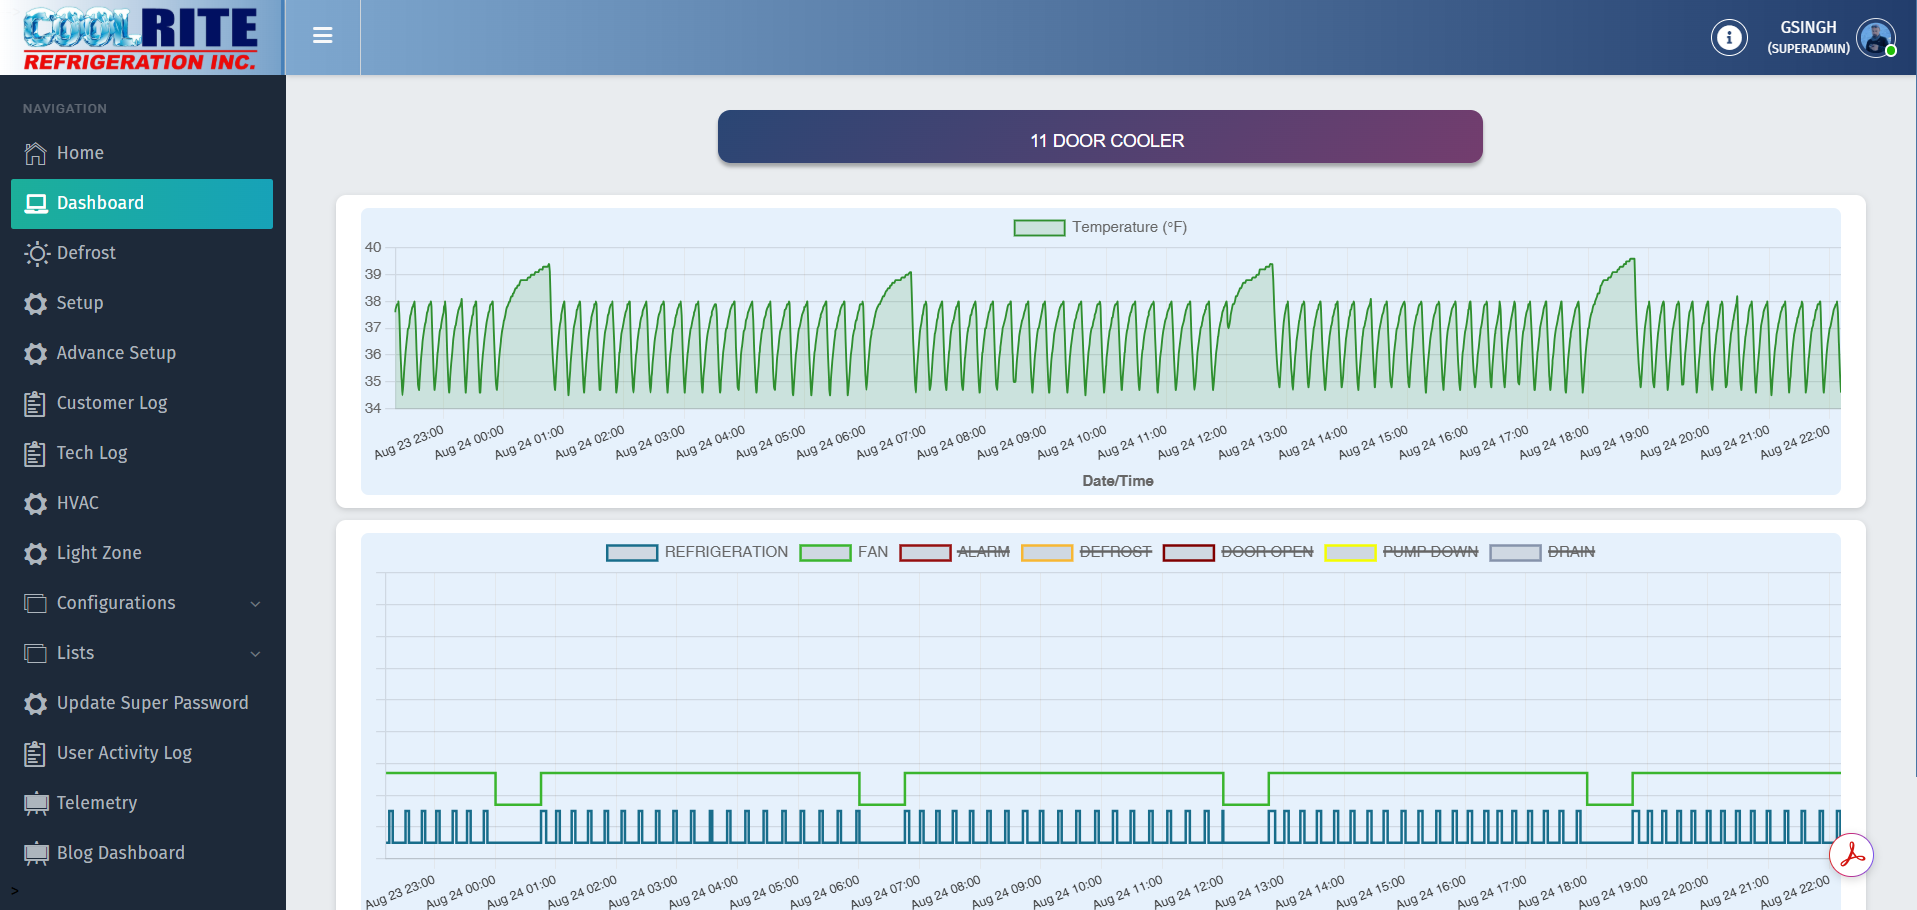
📈 Example: Real-Time Refrigeration Dashboard
On our CoolriteEMS Smart Refrigeration Dashboard, temperature, fan, defrost, and refrigeration cycles are tracked visually.
For example, managers can quickly notice when:
-
The system goes into defrost mode and how long it lasts.
-
A door is left open, causing temperature fluctuations.
-
The refrigeration cycle is too frequent, indicating potential mechanical issues.
This data ensures proactive maintenance, reducing the risk of costly downtime or product loss.
🌐 Remote Monitoring Advantage
With IoT-enabled refrigeration controllers, graphs can be accessed from anywhere—PC, tablet, or smartphone. This means store managers, technicians, and owners can stay informed 24/7 without being on-site.
🏆 Conclusion
Graphs are more than just visuals—they are the heartbeat of modern refrigeration systems. By analyzing trends in temperature, defrost cycles, and equipment performance, businesses can save money, protect products, and stay compliant with health regulations.
At CoolriteEMS, we provide advanced dashboards that make data simple, visual, and actionable—helping you take control of your refrigeration like never before.
👉 Call to Action:
Want to see how our Smart Commercial Refrigeration Graph Dashboard can benefit your business?
📞 Contact CoolriteEMS today for a free demo.